| Active TopicsSearchRegisterLogin |
| Resources and Support | |
| |
  |
| Author | Message |
|
vulthoom
Seaman 
Joined: 22 August 2011 Online Status: Offline Posts: 7 |
  Topic: Pallete color organize Topic: Pallete color organizePosted: 29 August 2011 at 9:14am |
|
Helo, not much to explain, but i need help with this...
I wanna to organize my pallete like this:  or something like color/brightness but with this collors  Help me please.  @Edit: after hours, i did this:  BUT STILLS WRONG, I KNOW D: Help me.² Edited by vulthoom - 29 August 2011 at 12:23pm |
|
 IP Logged IP Logged |
|
|
tanuki
Commander 
Joined: 01 April 2014 Online Status: Offline Posts: 333 |
Posted: 29 August 2011 at 12:47pm |
|
I put this together-
It's an HSB color chart with rows for Hue (basically what color it is) and columns for Value (how light or dark it is). Saturation isn't on here, but for that you'd either need a 3D chart or need to only allow certain ranges of saturation for certain ranges of either hue or value. Basically look at the HSB numbers for each color you want to put on the chart. If the hue of a color is something like 55° (yellow) then it'd go on the second row. If its value is something like 88 (a light color) then it'd go in the second to the last column. 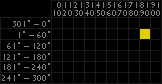
The chart is kind of basic and doesn't have room for a lot of variations, but you can put more than one color in a square if you want. Like this- 
Both of those colors belong in the same square of the chart. Edited by tanuki - 29 August 2011 at 12:53pm |
|
|
IP Logged |
|
|
DawnBringer
Commander
Joined: 11 August 2024 Online Status: Offline Posts: 568 |
Posted: 29 August 2011 at 1:58pm |
|
There's really nothing that's perfectly right: Colors are 3 dimensional data...as Tanuki touched; any 2d color diagram must be a dimensional reduction...and there's a zillion ways to do that. Normally you'd sacrifice Saturation in a HSL diagram as that is the least perceptually important dimension. However your palette is quite evenly distributed over different saturation-levels so it's not easy to ignore/mix the saturation without odd results. Here's some simple Hue-Brightness diagrams, also trying to split ramps of different saturation.

|
|
|
IP Logged |
|
|
vulthoom
Seaman
Joined: 22 August 2011 Online Status: Offline Posts: 7 |
Posted: 29 August 2011 at 3:56pm |
|
Is this what i'm talking, so ty.
Is no what i want, but is so close, i can finish. and, @dawnbringer, how did you do that ? Edited by vulthoom - 29 August 2011 at 3:57pm |
|
|
IP Logged |
|
|
DawnBringer
Commander
Joined: 11 August 2024 Online Status: Offline Posts: 568 |
Posted: 29 August 2011 at 8:37pm |
|
I have some custom scripts for Grafx2 that analyzes a palette and generates different hue-brightness diagrams (pretty much utilizing the same method described by Tanuki). By examine these one can find ramps etc. Then you just have to use your artistic abilites and experience to fix a useful chart. Note f.ex that you have two pure grays in your palette that fit nicely in the violett and cyan-ramps.
|
|
|
IP Logged |
|
|
ChrisButton
Commander
Joined: 10 September 2010 Online Status: Offline Posts: 371 |
Posted: 30 August 2011 at 1:12am |
|
I love the level of technicality you go into DawnBringer.
|
|
|
IP Logged |
|
|
vulthoom
Seaman
Joined: 22 August 2011 Online Status: Offline Posts: 7 |
Posted: 30 August 2011 at 10:46am |
|
@dawnbringer hmm sure sure, I heard about these scripts. Are Lua scripts, right ?
If u can send me, i would be very happy. I hate organize my pallets. |
|
|
IP Logged |
|
|
DawnBringer
Commander
Joined: 11 August 2024 Online Status: Offline Posts: 568 |
Posted: 30 August 2011 at 8:23pm |
|
IP Logged |
|
|
vulthoom
Seaman
Joined: 22 August 2011 Online Status: Offline Posts: 7 |
Posted: 31 August 2011 at 7:14am |
|
So ty. =]
|
|
|
IP Logged |
|
| |
||
Forum Jump |
You cannot post new topics in this forum You cannot reply to topics in this forum You cannot delete your posts in this forum You cannot edit your posts in this forum You cannot create polls in this forum You cannot vote in polls in this forum |
|
